
Mastering the 1 to 10 Times Tables Chart: A Guide for Students


Understanding the Times Tables Chart
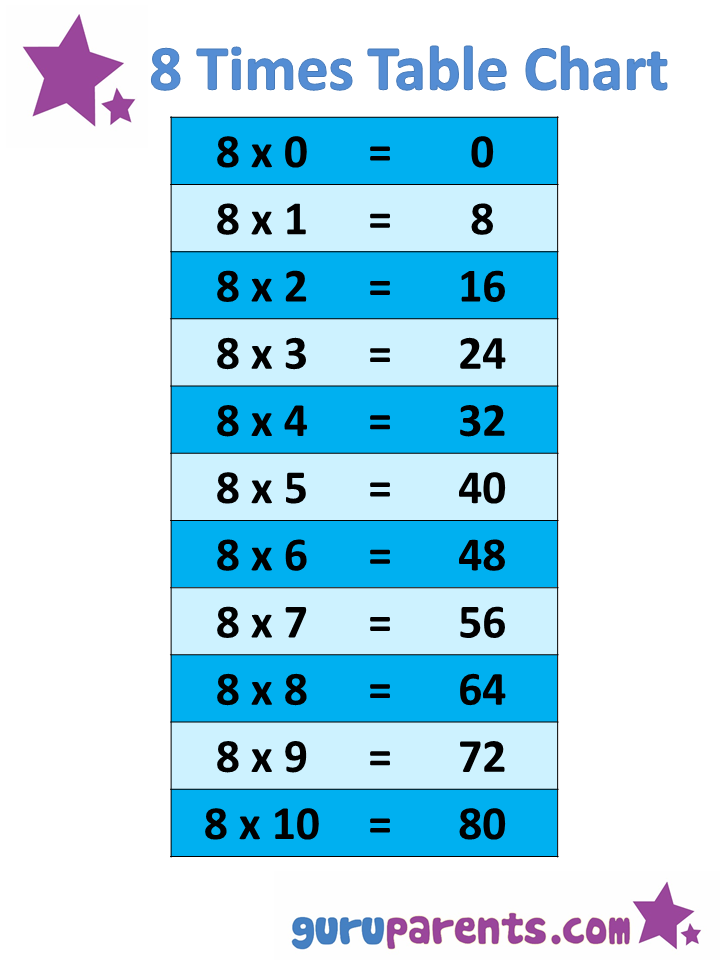
The 1 to 10 times tables chart is a fundamental tool for students to learn and master their multiplication skills. It's a simple yet effective way to help students memorize the multiplication tables from 1 to 10. With this chart, students can quickly and easily learn the multiplication facts and improve their overall math skills.
The times tables chart is a grid that displays the multiplication facts for each number from 1 to 10. It's a visual aid that helps students to see the relationships between the numbers and understand the patterns of multiplication. By using the chart, students can identify the multiplication facts that they need to work on and focus their practice on those areas.
Practicing with the 1 to 10 Times Tables Chart
To get the most out of the 1 to 10 times tables chart, students need to understand how to use it effectively. The chart is usually divided into rows and columns, with the numbers 1 to 10 listed along the top and side. The multiplication facts are then filled in at the intersections of the rows and columns. For example, the intersection of the row for 4 and the column for 5 would display the answer 20, which is the result of multiplying 4 and 5.
Once students understand how to use the chart, they can start practicing their multiplication skills. There are many ways to practice with the chart, such as quizzing themselves on the multiplication facts, playing games that involve multiplication, or using the chart to help with homework or tests. By practicing regularly with the 1 to 10 times tables chart, students can build their confidence and fluency with multiplication and develop a strong foundation for more advanced math skills.