
Mastering Division and Multiplication with a Chart


Understanding the Basics of Division and Multiplication
Division and multiplication are two fundamental operations in mathematics that are used to solve a wide range of problems. A division and multiplication chart is a useful tool that can help you understand the relationship between these two operations and make calculations easier. In this article, we will explore how to use a division and multiplication chart to improve your math skills and make learning more fun.
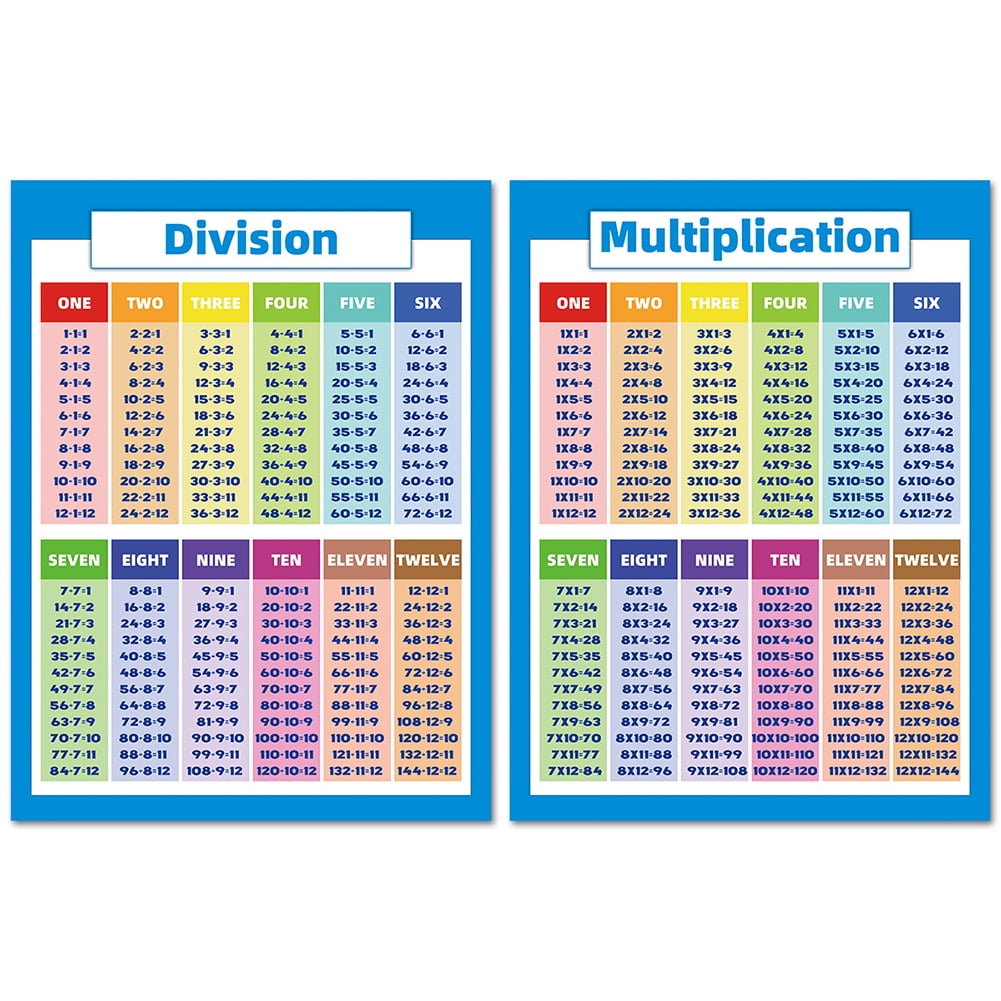
The division and multiplication chart is a table that shows the products and quotients of different numbers. It is a simple yet powerful tool that can help you visualize the relationships between numbers and identify patterns. By using a division and multiplication chart, you can quickly look up the product or quotient of two numbers and perform calculations with ease.
Creating a Division and Multiplication Chart
To use a division and multiplication chart effectively, you need to understand the basics of division and multiplication. Division is the operation of sharing a certain quantity into equal parts, while multiplication is the operation of repeated addition. For example, 6 ÷ 2 = 3 because 6 can be shared into 2 equal parts of 3, while 2 x 3 = 6 because 2 is added to itself 3 times.
Creating a division and multiplication chart is easy and fun. You can start by creating a table with numbers from 1 to 10 on the top row and left column. Then, fill in the products and quotients of each pair of numbers. For example, the product of 2 and 3 is 6, so you would write 6 in the cell where the row for 2 and the column for 3 intersect. By using a division and multiplication chart, you can simplify your math work and develop a deeper understanding of the relationships between numbers.